class: center, middle, inverse, title-slide # Tree Based Methods ## IS382 - Predictive Modeling ### Jason Bryer ### Week 7 --- # Classification and Regression Trees The goal of CART methods is to find best predictor in X of some outcome, y. CART methods do this recursively using the following procedures: * Find the best predictor in X for y. * Split the data into two based upon that predictor. * Repeat 1 and 2 with the split data sets until a stopping criteria has been reached. There are a number of possible stopping criteria including: Only one data point remains. * All data points have the same outcome value. * No predictor can be found that sufficiently splits the data. --- # Recursive Partitioning Logic of CART .pull-left[ Consider the scatter plot to the right with the following characteristics: * Binary outcome, G, coded “A” or “B”. * Two predictors, x and z * The vertical line at z = 3 creates the first partition. * The double horizontal line at x = -4 creates the second partition. * The triple horizontal line at x = 6 creates the third partition. ] .pull-right[ 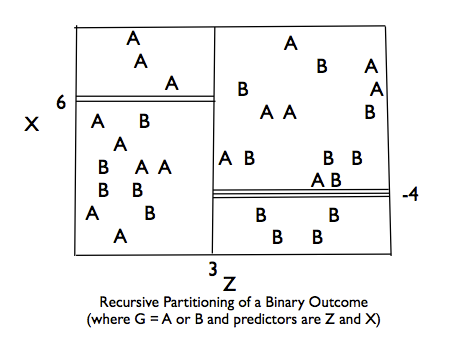 ] --- # Tree Structure .pull-left[ * The root node contains the full data set. * The data are split into two mutually exclusive pieces. Cases where x > ci go to the right, cases where x <= ci go to the left. * Those that go to the left reach a terminal node. * Those on the right are split into two mutually exclusive pieces. Cases where z > c2 go to the right and terminal node 3; cases where z <= c2 go to the left and terminal node 2. ] .pull-right[ 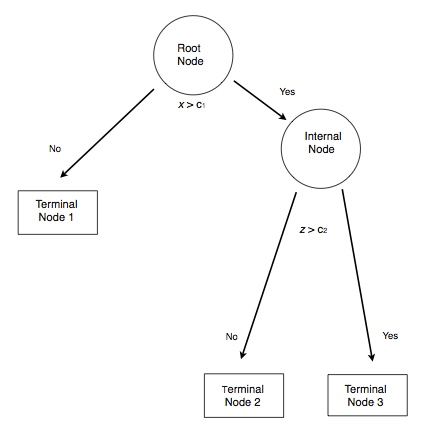 ] --- # Sum of Squared Errors The sum of squared errors for a tree *T* is: `$$S=\sum _{ c\in leaves(T) }^{ }{ \sum _{ i\in c }^{ }{ { (y-{ m }_{ c }) }^{ 2 } } }$$` Where, `\({ m }_{ c }=\frac { 1 }{ n } \sum _{ i\in c }^{ }{ { y }_{ i } }\)`, the prediction for leaf \textit{c}. Or, alternatively written as: `$$S=\sum _{ c\in leaves(T) }^{ }{ { n }_{ c }{ V }_{ c } }$$` Where `\(V_{c}\)` is the within-leave variance of leaf \textit{c}. Our goal then is to find splits that minimize S. --- # Advantages of CART Methods * Making predictions is fast. * It is easy to understand what variables are important in making predictions. * Trees can be grown with data containing missingness. For rows where we cannot reach a leaf node, we can still make a prediction by averaging the leaves in the sub-tree we do reach. * The resulting model will inherently include interaction effects. There are many reliable algorithms available. --- # Regression Trees In this example we will predict the median California house price from the house’s longitude and latitude. ``` r str(calif) ``` ``` ## 'data.frame': 20640 obs. of 10 variables: ## $ MedianHouseValue: num 452600 358500 352100 341300 342200 ... ## $ MedianIncome : num 8.33 8.3 7.26 5.64 3.85 ... ## $ MedianHouseAge : num 41 21 52 52 52 52 52 52 42 52 ... ## $ TotalRooms : num 880 7099 1467 1274 1627 ... ## $ TotalBedrooms : num 129 1106 190 235 280 ... ## $ Population : num 322 2401 496 558 565 ... ## $ Households : num 126 1138 177 219 259 ... ## $ Latitude : num 37.9 37.9 37.9 37.9 37.9 ... ## $ Longitude : num -122 -122 -122 -122 -122 ... ## $ cut.prices : Factor w/ 4 levels "[1.5e+04,1.2e+05]",..: 4 4 4 4 4 4 4 3 3 3 ... ``` --- # Tree 1 ``` r treefit <- tree(log(MedianHouseValue) ~ Longitude + Latitude, data=calif) plot(treefit); text(treefit, cex=0.75) ``` <img src="07-Trees_files/figure-html/unnamed-chunk-2-1.png" alt="" style="display: block; margin: auto;" /> --- # Tree 1 <img src="07-Trees_files/figure-html/unnamed-chunk-3-1.png" alt="" style="display: block; margin: auto;" /> --- # Tree 1 ``` r summary(treefit) ``` ``` ## ## Regression tree: ## tree(formula = log(MedianHouseValue) ~ Longitude + Latitude, ## data = calif) ## Number of terminal nodes: 12 ## Residual mean deviance: 0.1662 = 3429 / 20630 ## Distribution of residuals: ## Min. 1st Qu. Median Mean 3rd Qu. Max. ## -2.75900 -0.26080 -0.01359 0.00000 0.26310 1.84100 ``` Here “deviance” is the mean squared error, or root-mean-square error of `\(\sqrt{.166} = 0.41\)`. --- # Tree 2, Reduce Minimum Deviance We can increase the fit but changing the stopping criteria with the mindev parameter. ``` r treefit2 <- tree(log(MedianHouseValue) ~ Longitude + Latitude, data=calif, mindev=.001) summary(treefit2) ``` ``` ## ## Regression tree: ## tree(formula = log(MedianHouseValue) ~ Longitude + Latitude, ## data = calif, mindev = 0.001) ## Number of terminal nodes: 68 ## Residual mean deviance: 0.1052 = 2164 / 20570 ## Distribution of residuals: ## Min. 1st Qu. Median Mean 3rd Qu. Max. ## -2.94700 -0.19790 -0.01872 0.00000 0.19970 1.60600 ``` With the larger tree we now have a root-mean-square error of 0.32. --- # Tree 2, Reduce Minimum Deviance <img src="07-Trees_files/figure-html/unnamed-chunk-6-1.png" alt="" style="display: block; margin: auto;" /> --- # Tree 3, Include All Variables However, we can get a better fitting model by including the other variables. ``` r treefit3 <- tree(log(MedianHouseValue) ~ ., data=calif) summary(treefit3) ``` ``` ## ## Regression tree: ## tree(formula = log(MedianHouseValue) ~ ., data = calif) ## Variables actually used in tree construction: ## [1] "cut.prices" ## Number of terminal nodes: 4 ## Residual mean deviance: 0.03608 = 744.5 / 20640 ## Distribution of residuals: ## Min. 1st Qu. Median Mean 3rd Qu. Max. ## -1.718000 -0.127300 0.009245 0.000000 0.130000 0.358600 ``` With all the available variables, the root-mean-square error is 0.11. --- # Classification Trees Predicting who survived the Titanic. * `pclass`: Passenger class (1 = 1st; 2 = 2nd; 3 = 3rd) * `survival`: A Boolean indicating whether the passenger survived or not (0 = No; 1 = Yes); this is our target * `name`: A field rich in information as it contains title and family names * `sex`: male/female * `age`: Age, a significant portion of values are missing * `sibsp`: Number of siblings/spouses aboard * `parch`: Number of parents/children aboard * `ticket`: Ticket number. * `fare`: Passenger fare (British Pound). * `cabin`: Does the location of the cabin influence chances of survival? * `embarked`: Port of embarkation (C = Cherbourg; Q = Queenstown; S = Southampton) * `boat`: Lifeboat, many missing values * `body`: Body Identification Number * `home.dest`: Home/destination --- # Classification using `rpart` ``` r (titanic.rpart <- rpart(survived ~ pclass + sex + age + sibsp, data=titanic.train)) ``` ``` ## n= 981 ## ## node), split, n, deviance, yval ## * denotes terminal node ## ## 1) root 981 231.6514000 0.3822630 ## 2) sex=male 640 98.7437500 0.1906250 ## 4) pclass>=1.5 497 62.2776700 0.1468813 ## 8) age>=4.5 460 52.1739100 0.1304348 * ## 9) age< 4.5 37 8.4324320 0.3513514 ## 18) pclass>=2.5 28 4.1071430 0.1785714 * ## 19) pclass< 2.5 9 0.8888889 0.8888889 * ## 5) pclass< 1.5 143 32.2097900 0.3426573 * ## 3) sex=female 341 65.2903200 0.7419355 ## 6) pclass>=2.5 157 39.2101900 0.5159236 * ## 7) pclass< 2.5 184 11.2173900 0.9347826 * ``` --- # Classification using `rpart` ``` r plot(titanic.rpart); text(titanic.rpart, use.n=TRUE, cex=1) ``` <img src="07-Trees_files/figure-html/unnamed-chunk-9-1.png" alt="" style="display: block; margin: auto;" /> --- # Classification using `ctree` ``` r (titanic.ctree <- ctree(survived ~ pclass + sex + age + sibsp, data=titanic.train)) ``` ``` ## ## Conditional inference tree with 9 terminal nodes ## ## Response: survived ## Inputs: pclass, sex, age, sibsp ## Number of observations: 981 ## ## 1) sex == {female}; criterion = 1, statistic = 286.055 ## 2) pclass <= 2; criterion = 1, statistic = 75.735 ## 3) pclass <= 1; criterion = 0.989, statistic = 9.029 ## 4)* weights = 107 ## 3) pclass > 1 ## 5)* weights = 77 ## 2) pclass > 2 ## 6) sibsp <= 2; criterion = 0.99, statistic = 9.086 ## 7)* weights = 143 ## 6) sibsp > 2 ## 8)* weights = 14 ## 1) sex == {male} ## 9) pclass <= 1; criterion = 1, statistic = 22.494 ## 10) age <= 36; criterion = 0.991, statistic = 9.236 ## 11)* weights = 45 ## 10) age > 36 ## 12)* weights = 98 ## 9) pclass > 1 ## 13) age <= 4; criterion = 0.993, statistic = 9.853 ## 14) pclass <= 2; criterion = 0.999, statistic = 14.671 ## 15)* weights = 9 ## 14) pclass > 2 ## 16)* weights = 28 ## 13) age > 4 ## 17)* weights = 460 ``` --- # Classification using `ctree` ``` r plot(titanic.ctree) ``` <img src="07-Trees_files/figure-html/unnamed-chunk-11-1.png" alt="" style="display: block; margin: auto;" /> --- # Model Performance The use of statistical models to predict outcomes, typically on new data, is called predictive modeling. Logistic regression is a common statistical procedure used for prediction. We will utilize a **confusion matrix** to evaluate accuracy of the predictions. <img src="images/Confusion_Matrix.png" alt="" width="1100" style="display: block; margin: auto;" /> --- class: font80 # Predicting Heart Attacks Source: https://www.kaggle.com/datasets/imnikhilanand/heart-attack-prediction?select=data.csv ``` r heart <- read.csv('../course_data/heart_attack_predictions.csv') heart <- heart |> mutate_if(is.character, as.numeric) |> select(!c(slope, ca, thal)) str(heart) ``` ``` ## 'data.frame': 294 obs. of 11 variables: ## $ age : int 28 29 29 30 31 32 32 32 33 34 ... ## $ sex : int 1 1 1 0 0 0 1 1 1 0 ... ## $ cp : int 2 2 2 1 2 2 2 2 3 2 ... ## $ trestbps: num 130 120 140 170 100 105 110 125 120 130 ... ## $ chol : num 132 243 NA 237 219 198 225 254 298 161 ... ## $ fbs : num 0 0 0 0 0 0 0 0 0 0 ... ## $ restecg : num 2 0 0 1 1 0 0 0 0 0 ... ## $ thalach : num 185 160 170 170 150 165 184 155 185 190 ... ## $ exang : num 0 0 0 0 0 0 0 0 0 0 ... ## $ oldpeak : num 0 0 0 0 0 0 0 0 0 0 ... ## $ num : int 0 0 0 0 0 0 0 0 0 0 ... ``` Note: `num` is the diagnosis of heart disease (angiographic disease status) (i.e. Value 0: < 50% diameter narrowing -- Value 1: > 50% diameter narrowing) --- # Missing Data We will save this for another day... ``` r complete.cases(heart) |> table() ``` ``` ## ## FALSE TRUE ## 33 261 ``` ``` r mice_out <- mice::mice(heart, m = 1) ``` ``` ## ## iter imp variable ## 1 1 trestbps chol fbs restecg thalach exang ## 2 1 trestbps chol fbs restecg thalach exang ## 3 1 trestbps chol fbs restecg thalach exang ## 4 1 trestbps chol fbs restecg thalach exang ## 5 1 trestbps chol fbs restecg thalach exang ``` ``` r heart <- mice::complete(mice_out) ``` --- # Data Setup We will split the data into a training set (70% of observations) and validation set (30%). ``` r train.rows <- sample(nrow(heart), nrow(heart) * .7) heart_train <- heart[train.rows,] heart_test <- heart[-train.rows,] ``` This is the proportions of survivors and defines what our "guessing" rate is. That is, if we guessed no one had a heart attack, we would be correct 62% of the time. ``` r (heart_attack <- table(heart_train$num) %>% prop.table) ``` ``` ## ## 0 1 ## 0.6487805 0.3512195 ``` --- class: font80 # Model Training ``` r lr.out <- glm(num ~ ., data=heart_train, family=binomial(link = 'logit')) summary(lr.out) ``` ``` ## ## Call: ## glm(formula = num ~ ., family = binomial(link = "logit"), data = heart_train) ## ## Coefficients: ## Estimate Std. Error z value Pr(>|z|) ## (Intercept) -3.783098 3.514862 -1.076 0.281786 ## age -0.019136 0.031996 -0.598 0.549798 ## sex 1.240987 0.573514 2.164 0.030477 * ## cp 0.709474 0.263601 2.691 0.007114 ** ## trestbps 0.000947 0.013105 0.072 0.942391 ## chol 0.005128 0.003479 1.474 0.140477 ## fbs 1.494179 0.931350 1.604 0.108645 ## restecg -0.504033 0.510151 -0.988 0.323149 ## thalach -0.011925 0.012165 -0.980 0.326959 ## exang 1.167644 0.573909 2.035 0.041896 * ## oldpeak 1.231519 0.355028 3.469 0.000523 *** ## --- ## Signif. codes: 0 '***' 0.001 '**' 0.01 '*' 0.05 '.' 0.1 ' ' 1 ## ## (Dispersion parameter for binomial family taken to be 1) ## ## Null deviance: 265.76 on 204 degrees of freedom ## Residual deviance: 140.16 on 194 degrees of freedom ## AIC: 162.16 ## ## Number of Fisher Scoring iterations: 5 ``` --- # Predicted Values ``` r heart_train$prediction <- predict(lr.out, type = 'response', newdata = heart_train) ggplot(heart_train, aes(x = prediction, color = num == 1)) + geom_density() ``` <img src="07-Trees_files/figure-html/unnamed-chunk-18-1.png" alt="" style="display: block; margin: auto;" /> --- # Results ``` r heart_train$prediction_class <- heart_train$prediction > 0.5 tab <- table(heart_train$prediction_class, heart_train$num) %>% prop.table() %>% print() ``` ``` ## ## 0 1 ## FALSE 0.59512195 0.09268293 ## TRUE 0.05365854 0.25853659 ``` For the training set, the overall accuracy is 85.37%. Recall that 64.88% people did not have a heart attach. Therefore, the simplest model would be to predict that no one had a heart attack, which would mean we would be correct 64.88% of the time. Therefore, our prediction model is 20.49% better than guessing. --- # Checking with the validation dataset ``` r (survived_test <- table(heart_test$num) %>% prop.table()) ``` ``` ## ## 0 1 ## 0.6179775 0.3820225 ``` ``` r heart_test$prediction <- predict(lr.out, newdata = heart_test, type = 'response') heart_test$prediciton_class <- heart_test$prediction > 0.5 tab_test <- table(heart_test$prediciton_class, heart_test$num) %>% prop.table() %>% print() ``` ``` ## ## 0 1 ## FALSE 0.56179775 0.08988764 ## TRUE 0.05617978 0.29213483 ``` The overall accuracy is 85.39%, or 23.6% better than guessing. --- class: font90 # Receiver Operating Characteristic (ROC) Curve The ROC curve is created by plotting the true positive rate (TPR; AKA sensitivity) against the false positive rate (FPR; AKA probability of false alarm) at various threshold settings. .pull-left[ In a classification model, outcomes are either as positive (*p*) or negative (*n*). There are then four possible outcomes: * **true positive** (TP) The outcome from a prediction is *p* and the actual value is also *p*. * **false positive** (FP) The actual value is *n*. * **true negative** (TN) Both the prediction outcome and the actual value are *n*. * **false negative** (FN) The prediction outcome is *n* while the actual value is *p*. ] .pull-right[ 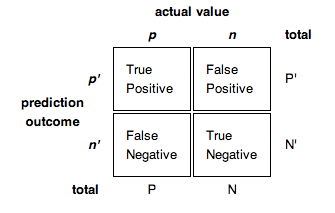 ``` r roc <- calculate_roc(heart_train$prediction, heart_train$num == 1) summary(roc) ``` ``` ## AUC = 0.908 ## Cost of false-positive = 1 ## Cost of false-negative = 1 ## Threshold with minimum cost = 0.606 ``` ] --- # ROC Curve .center[ 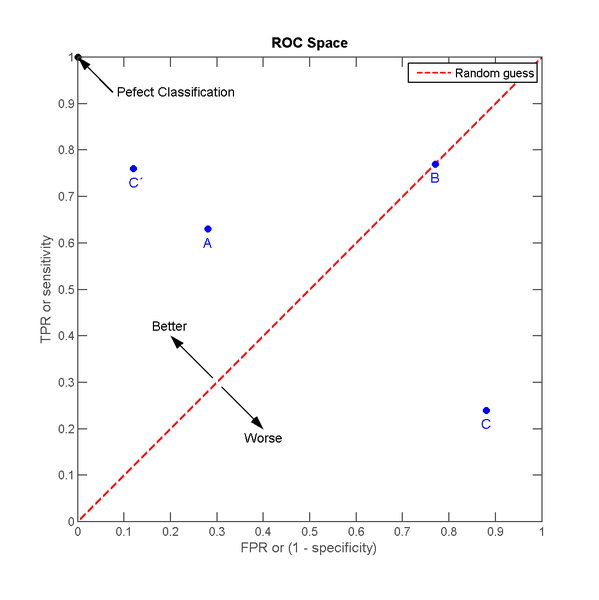 ] --- # ROC Curve ``` r plot(roc, curve = 'accuracy') ``` <img src="07-Trees_files/figure-html/unnamed-chunk-22-1.png" alt="" style="display: block; margin: auto;" /> --- # ROC Curve ``` r plot(roc, curve = 'cost') ``` <img src="07-Trees_files/figure-html/unnamed-chunk-23-1.png" alt="" style="display: block; margin: auto;" /> --- # ROC Curve (false-negative up-weighted) .pull-left[ ``` r roc2 <- calculate_roc( heart_train$prediction, heart_train$num == 1, cost_of_fn = 2, cost_of_fp = 1) summary(roc2) ``` ``` ## AUC = 0.908 ## Cost of false-positive = 1 ## Cost of false-negative = 2 ## Threshold with minimum cost = 0.525 ``` ] .pull-right[ ``` r plot(roc2, curve = 'cost') ``` <img src="07-Trees_files/figure-html/unnamed-chunk-25-1.png" alt="" style="display: block; margin: auto;" /> ] --- class: font90 # Caution on Interpreting Accuracy - [Loh, Sooo, and Zing](http://cs229.stanford.edu/proj2016/report/LohSooXing-PredictingSexualOrientationBasedOnFacebookStatusUpdates-report.pdf) (2016) predicted sexual orientation based on Facebook Status. - They reported model accuracies of approximately 90% using SVM, logistic regression and/or random forest methods. -- - [Gallup](https://news.gallup.com/poll/234863/estimate-lgbt-population-rises.aspx) (2018) poll estimates that 4.5% of the Americal population identifies as LGBTG+. -- - *My proposed model:* I predict all Americans are heterosexual. - The accuracy of my model is 95.5%, or *5.5% better than Facebook's model!* - Predicting "rare" events (i.e. when the proportion of one of the two outcomes large) is difficult and requires independent (predictor) variables that strongly associated with the dependent (outcome) variable. --- # Fitted Values Revisited What happens when the ratio of true-to-false increases (i.e. want to predict "rare" events)? Let's simulate a dataset where the ratio of true-to-false is 10-to-1. We can also define the distribution of the dependent variable. Here, there is moderate separation in the distributions. ``` r test.df2 <- getSimulatedData( treat.mean=.6, control.mean=.4) ``` The `multilevelPSA::psrange` function will sample with varying ratios from 1:10 to 1:1. It takes multiple samples and averages the ranges and distributions of the fitted values from logistic regression. ``` r psranges2 <- psrange(test.df2, test.df2$treat, treat ~ ., samples=seq(100,1000,by=100), nboot=20) ``` --- # Fitted Values Revisited (cont.) ``` r plot(psranges2) ``` <img src="07-Trees_files/figure-html/unnamed-chunk-29-1.png" alt="" style="display: block; margin: auto;" /> --- class: left, font140 # One Minute Paper .pull-left[ 1. What was the most important thing you learned during this class? 2. What important question remains unanswered for you? ] .pull-right[ <img src="07-Trees_files/figure-html/unnamed-chunk-30-1.png" alt="" style="display: block; margin: auto;" /> .center[.font50[[Scan the QR code or click here to complete the One Minute Paper](https://docs.google.com/forms/d/e/1FAIpQLSdkRhGhJpsgc_0LxAmJpemlf7bni8Qs0ZUmovOVvHaOwOQyhA/viewform?usp=pp_url&entry.603740146=Fall2026&entry.1577539103=Tree%20Based%20Methods&entry.1379071784=IS382)]] ]